Файл:World PVOUT Solar-resource-map GlobalSolarAtlas World-Bank-Esmap-Solargis.png

Исходный файл (1889 × 1122 пкс, размер файла: 1,37 МБ, MIME-тип: image/png)
Этот файл находится на Викискладе. Сведения о нём показаны ниже.
Викисклад — централизованное хранилище для свободных файлов, используемых в проектах Викимедиа.
|
Краткое описание
| Описание |
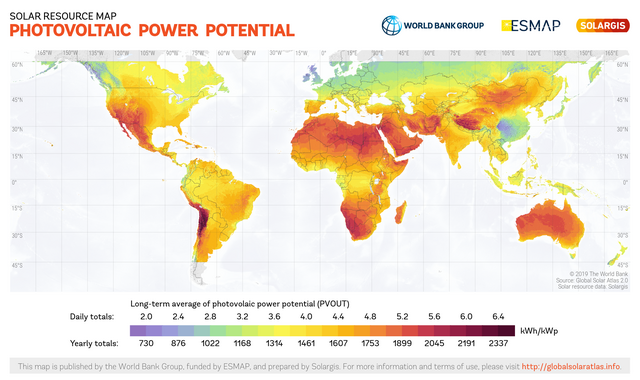
English: This solar resource map provides a summary of the estimated solar energy available for power generation and other energy applications. It represents the average daily/yearly sum of electricity production from a 1 kW-peak grid-connected solar PV power plant covering the period from 1994/1999/2007 (depending on the geographical region) to 2015. The underlying solar resource database is calculated by the Solargis model from atmospheric and satellite data with 15-minute and 30-minute time step respectively, and a spatial resolution of 1 km. Further details available from: https://globalsolaratlas.info. |
||
| Дата | |||
| Источник | https://globalsolaratlas.info | ||
| Автор | Solargis | ||
| Права (Повторное использование этого файла) |
https://globalsolaratlas.info/support/terms-of-use
|
||
| Атрибуция (требуется лицензией) | © The World Bank / | ||

The World Bank and the International Finance Corporation (IFC), collectively the World Bank Group, have published this solar resource map alongside a Global Solar Atlas consisting of global, regional and country maps, to support the scale-up of solar power in our client countries. This work is funded by the Energy Sector Management Assistance Program (ESMAP), a multi-donor trust fund administered by The World Bank and supported by 13 official bilateral donors. It is part of a global ESMAP initiative on Renewable Energy Resource Mapping that covers biomass, small hydro, solar and wind. The World Bank Group has selected Solargis as its global provider of solar resource data and related services, and this map has been prepared by Solargis, under contract to The World Bank, based on a solar resource database that they own and maintain. To obtain additional maps and information, please visit: http://globalsolaratlas.info.
Лицензирование
- Вы можете свободно:
- делиться произведением – копировать, распространять и передавать данное произведение
- создавать производные – переделывать данное произведение
- При соблюдении следующих условий:
- атрибуция – Вы должны указать авторство, предоставить ссылку на лицензию и указать, внёс ли автор какие-либо изменения. Это можно сделать любым разумным способом, но не создавая впечатление, что лицензиат поддерживает вас или использование вами данного произведения.
История файла
Нажмите на дату/время, чтобы посмотреть файл, который был загружен в тот момент.
| Дата/время | Миниатюра | Размеры | Участник | Примечание | |
|---|---|---|---|---|---|
| текущий | 10:58, 15 июля 2020 | | 1889 × 1122 (1,37 МБ) | Juraj.betak | Upgraded data on the map (climate period now to 2018, before to 2015; PVOUT data calculated with updated Solargis model) |
| 13:36, 25 сентября 2018 |  | 1889 × 1122 (1,68 МБ) | O-Jay | User created page with UploadWizard |
Использование файла
Следующая страница использует этот файл:
Глобальное использование файла
Данный файл используется в следующих вики:
- Использование в ca.wikipedia.org
- Использование в cs.wikipedia.org
- Использование в de.wikipedia.org
- Использование в en.wikipedia.org
- Использование в es.wikipedia.org
- Использование в fa.wikipedia.org
- Использование в sr.wikipedia.org
- Использование в uk.wikipedia.org
- Использование в ur.wikipedia.org