Перейти на страницу файла на Викискладе

Файл:1000 Year Temperature Comparison.png

Материал из Википедии — свободной энциклопедии
Перейти к навигации Перейти к поиску

1000_Year_Temperature_Comparison.png (599 × 442 пкс, размер файла: 32 КБ, MIME-тип: image/png)

Этот график желательно воссоздать или аккуратно преобразовать в векторный формат SVG. Это даёт несколько преимуществ, прочитать о которых подробнее вы можете на странице Commons:Media for cleanup. Если вам уже сейчас доступна векторная версия данного изображения, загрузите её, пожалуйста, а затем замените этот шаблон на следующий: {{Vector version available|Имя загруженного файла.svg}}.

Краткое описание

Описание
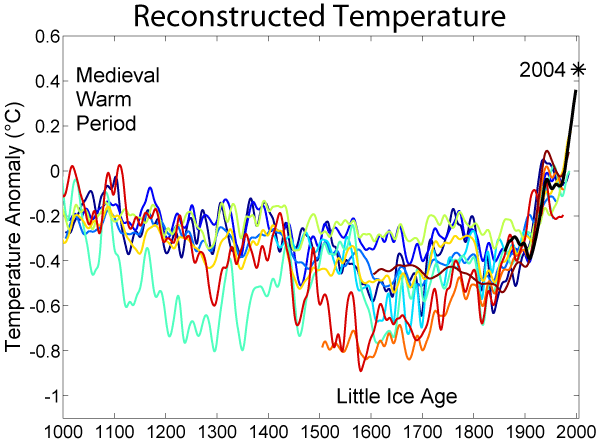
English: This image is a comparison of 10 different published reconstructions of mean temperature changes during the 2nd millennium. More recent reconstructions are plotted towards the front and in redder colors, older reconstructions appear towards the back and in bluer colors. An instrumental history of temperature is also shown in black. The medieval warm period and little ice age are labeled at roughly the times when they are historically believed to occur, though it is still disputed whether these were truly global or only regional events. The single, unsmoothed annual value for 2004 is also shown for comparison. (Image:Instrumental Temperature Record.png shows how 2004 relates to other recent years).

It is unknown which, if any, of these reconstructions is an accurate representation of climate history; however, these curves are a fair representation of the range of results appearing in the published scientific literature. Hence, it is likely that such reconstructions, accurate or not, will play a significant role in the ongoing discussions of global climate change and global warming.

For each reconstruction, the raw data has been decadally smoothed with a σ = 5 yr Gaussian weighted moving average. Also, each reconstruction was adjusted so that its mean matched the mean of the instrumental record during the period of overlap. The variance (i.e. the scale of fluctuations) was not adjusted (except in one case noted below).

Except as noted below, all original data for this comparison comes from here and links therein. It should also be noted that many reconstructions of past climate report substantial error bars, which are not represented on this figure.
Дата
Источник http://www.globalwarmingart.com/wiki/File:1000_Year_Temperature_Comparison.png
Автор Robert A. Rohde
Другие версии

Reconstructions

The reconstructions used, in order from oldest to most recent publication are:

  1. (dark blue 1000-1991): The Holocene.
  2. (blue 1000-1980): Geophysical Research Letters.
  3. (light blue 1000-1965): Ambio. Modified as published in Science.
  4. (lightest blue 1402-1960): J. Geophys. Res..
  5. (light green 831-1992): Science.
  6. (yellow 200-1980): Geophysical Research Letters. doi:10.1029/2003GL017814.
  7. (orange 200-1995): Reviews of Geophysics. doi:10.1029/2003RG000143
  8. (red-orange 1500-1980): Geophys. Res Lett.. doi:10.1029/2004GL019781
  9. (red 1-1979): Nature. doi:10.1038/nature03265
  10. (dark red 1600-1990): Science. doi:10.1126/science.1107046

(black 1856-2004): Instrumental data was jointly compiled by the Climatic Research Unit and the UK Meteorological Office Hadley Centre. Global Annual Average data set TaveGL2v [1] was used.

Documentation for the most recent update of the CRU/Hadley instrumental data set appears in: Journal of Climate.

Лицензирование

The original version of this figure was prepared by Robert A. Rohde from publicly available data and is incorporated into the Global Warming Art project.

Image from Global Warming Art
This image is an original work created for Global Warming Art. Please refer to the Year Temperature Comparison.png image description page for more information.
GNU head Разрешается копировать, распространять и/или изменять этот документ в соответствии с условиями GNU Free Documentation License версии 1.2 или более поздней, опубликованной Фондом свободного программного обеспечения, без неизменяемых разделов, без текстов, помещаемых на первой и последней обложке. Копия лицензии включена в раздел, озаглавленный GNU Free Documentation License.
w:ru:Creative Commons
атрибуция распространение на тех же условиях
Этот файл доступен по лицензии Creative Commons Attribution-Share Alike 3.0 Unported.
Вы можете свободно:
  • делиться произведением – копировать, распространять и передавать данное произведение
  • создавать производные – переделывать данное произведение
При соблюдении следующих условий:
  • атрибуция – Вы должны указать авторство, предоставить ссылку на лицензию и указать, внёс ли автор какие-либо изменения. Это можно сделать любым разумным способом, но не создавая впечатление, что лицензиат поддерживает вас или использование вами данного произведения.
  • распространение на тех же условиях – Если вы изменяете, преобразуете или создаёте иное произведение на основе данного, то обязаны использовать лицензию исходного произведения или лицензию, совместимую с исходной.
Этот признак лицензирования был добавлен к этому файлу как часть обновления лицензии GFDL.


Notes

  1. Data from Moberg et al. was taken directly from the supplemental information accompanying the Nature article.
  2. Data for Oerlemans was provided by William M. Connolley.
  3. Esper et al. reported only fluctuations in "arbitrary" units, so the variance in this record was rescaled to match the variance during the period of overlap with the instrumental record.
  4. When a paper included multiple reconstructions, the global annually average temperature data was used. If this was not reported, then Northern Hemisphere annually averaged data was used.
  5. Four records appearing at [2] were not used in preparing this graph for the following reasons:
    1. Mann et al. 98 was not included because Mann et al. 99 extended and updated that record.
    2. Briffa et al. 98 was not included because Briffa et al. 2001 extended and updated that record.
    3. Pollack et al. 98 was not included because the reported data was not found to be in a form that allowed for easy replotting.
    4. Mann et al. 2000 was not used because it did not include an original reconstruction covering at least the Northern Hemisphere.


Dragons flight's Temperature Record Series
This figure is part of a series of plots created by Dragons flight to illustrate
changes in Earth's temperature and climate across many different time scales.
Time Period: 25 yrs | 150 yrs | 1 kyr | 2 kyr | 12 kyr | 450 kyr | 5 Myr | 65 Myr | 500 Myr
For articles related to this topic see: Temperature record

Краткие подписи

Добавьте однострочное описание того, что собой представляет этот файл

Элементы, изображённые на этом файле

изображённый объект

image/png

442 пиксель

599 пиксель

История файла

Нажмите на дату/время, чтобы посмотреть файл, который был загружен в тот момент.

Дата/времяМиниатюраРазмерыУчастникПримечание
текущий23:14, 21 ноября 2019Миниатюра для версии от 23:14, 21 ноября 2019599 × 442 (32 КБ)MyridiumSomebody updated the image with a "2016" label that isn't even included in the data analysed! Data analysed only goes up to 2004.
06:54, 5 мая 2019Миниатюра для версии от 06:54, 5 мая 2019599 × 500 (48 КБ)TobusUpdate to show 2016 temperature anomaly
17:10, 16 июля 2014Миниатюра для версии от 17:10, 16 июля 2014599 × 442 (32 КБ)JeffyPShrinkin' the image.
22:51, 17 декабря 2005Миниатюра для версии от 22:51, 17 декабря 2005599 × 442 (40 КБ)Saperaud~commonswiki*'''Description:''' [[en:Image:{{subst:PAGENAME}}]]

Следующая страница использует этот файл:

Глобальное использование файла

Данный файл используется в следующих вики: