Файл:Kernel trick idea.svg
Перейти к навигации
Перейти к поиску

Размер этого PNG-превью для исходного SVG-файла: 800 × 343 пкс. Другие разрешения: 320 × 137 пкс | 640 × 274 пкс | 1024 × 439 пкс | 1280 × 549 пкс | 2560 × 1097 пкс | 1344 × 576 пкс.
Исходный файл (SVG-файл, номинально 1344 × 576 пкс, размер файла: 13 Кб)
Этот файл находится на Викискладе. Сведения о нём показаны ниже.
Викисклад — централизованное хранилище для свободных файлов, используемых в проектах Викимедиа.
|
Краткое описание
| Описание |
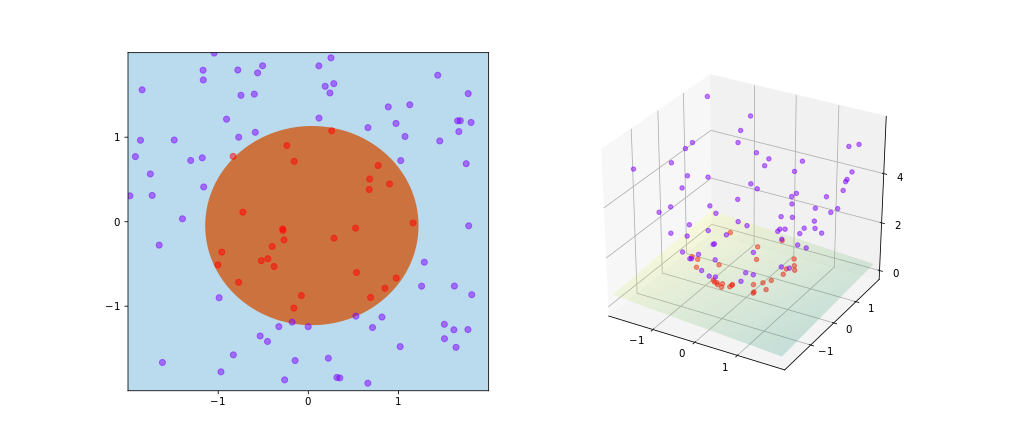
English: An illustration of kernel trick in SVM. Here the kernel is given by:
|
| Дата | |
| Источник | Собственная работа |
| Автор | Shiyu Ji |


Python Source Code
import numpy as np
import matplotlib
matplotlib.use('svg')
import matplotlib.pyplot as plt
from sklearn import svm
from matplotlib import cm

# Prepare the training set.
# Suppose there is a circle with center at (0, 0) and radius 1.2.
# All the points within the circle are labeled 1.
# All the points outside the circle are labeled 0.
nSamples = 100
spanLen = 2
X = np.zeros((nSamples, 2))
y = np.zeros((nSamples, ))

for i in range(nSamples):
  a, b = [np.random.uniform(-spanLen, spanLen) for _ in ['x', 'y']]
  X[i][0], X[i][1] = a, b
  y[i] = 1 if a*a + b*b < 1.2*1.2 else 0

# Custom kernel,
def my_kernel(A, B):
  gram = np.zeros((A.shape[0], B.shape[0]))
  for i in range(A.shape[0]):
    for j in range(B.shape[0]):
      assert A.shape[1] == B.shape[1]
      L2A, L2B = 0.0, 0.0
      for k in range(A.shape[1]):
        gram[i, j] += A[i, k] * B[j, k]
        L2A += A[i, k] * A[i, k]
        L2B += B[j, k] * B[j, k]
      gram[i, j] += L2A * L2B
  return gram

# SVM train.
clf = svm.SVC(kernel = my_kernel)
clf.fit(X, y)
coef = clf.dual_coef_[0]
sup = clf.support_
b = clf.intercept_
x_min, x_max = -spanLen, spanLen
y_min, y_max = -spanLen, spanLen
xx, yy = np.meshgrid(np.arange(x_min, x_max, .02), np.arange(y_min, y_max, .02))
Z = clf.predict(np.c_[xx.ravel(), yy.ravel()])
Z = Z.reshape(xx.shape)

# Plot the 2D layout.
fig = plt.figure(figsize = (6, 14))
plt1 = plt.subplot(121)
plt1.set_xlim([-spanLen, spanLen])
plt1.set_ylim([-spanLen, spanLen])
plt1.set_xticks([-1, 0, 1])
plt1.set_yticks([-1, 0, 1])
plt1.pcolormesh(xx, yy, Z, cmap=cm.Paired)
y_unique = np.unique(y)
colors = cm.rainbow(np.linspace(0.0, 1.0, y_unique.size))
for this_y, color in zip(y_unique, colors):
  this_Xx = [X[i][0] for i in range(len(X)) if y[i] == this_y]
  this_Xy = [X[i][1] for i in range(len(X)) if y[i] == this_y]
  plt1.scatter(this_Xx, this_Xy, c=color, alpha=0.5)

# Process the training data into 3D by applying the kernel mapping:
# phi(x, y) = (x, y, x*x + y*y).
X3d = np.ndarray((X.shape[0], 3))
for i in range(X.shape[0]):
    a, b = X[i][0], X[i][1]
    X3d[i, 0], X3d[i, 1], X3d[i, 2] = [a, b, a*a + b*b]

# Plot the 3D layout after applying the kernel mapping.
from mpl_toolkits.mplot3d import Axes3D
plt2 = plt.subplot(122, projection="3d")
plt2.set_xlim([-spanLen, spanLen])
plt2.set_ylim([-spanLen, spanLen])
plt2.set_xticks([-1, 0, 1])
plt2.set_yticks([-1, 0, 1])
plt2.set_zticks([0, 2, 4])
for this_y, color in zip(y_unique, colors):
  this_Xx = [X3d[i, 0] for i in range(len(X3d)) if y[i] == this_y]
  this_Xy = [X3d[i, 1] for i in range(len(X3d)) if y[i] == this_y]
  this_Xz = [X3d[i, 2] for i in range(len(X3d)) if y[i] == this_y]
  plt2.scatter(this_Xx, this_Xy, this_Xz, c=color, alpha=0.5)

# Plot the 3D boundary.
def onBoundary(x, y, z, X3d, coef, sup, b):
  err = 0.0
  n = len(coef)
  for i in range(n):
    err += coef[i] * (x*X3d[sup[i], 0] + y*X3d[sup[i], 1] + z*X3d[sup[i], 2])
  err += b
  if abs(err) < .1:
    return True
  return False

Xr = np.arange(x_min, x_max, .02)
Yr = np.arange(y_min, y_max, .02)
Z = np.zeros(Z.shape)
for i in range(Xr.shape[0]):
  x = Xr[i]
  for j in range(Yr.shape[0]):
    y = Yr[j]
    for z in np.arange(0, 2, .02):
      if onBoundary(x, y, z, X3d, coef, sup, b):
        Z[i, j] = z
        break
plt2.plot_surface(xx, yy, Z, cmap='summer', alpha=0.2)

plt.savefig("kernel_trick_idea.svg", format = "svg")
Лицензирование
Я, владелец авторских прав на это произведение, добровольно публикую его на условиях следующей лицензии:
Этот файл доступен по лицензии Creative Commons Attribution-Share Alike 4.0 International
- Вы можете свободно:
- делиться произведением – копировать, распространять и передавать данное произведение
- создавать производные – переделывать данное произведение
- При соблюдении следующих условий:
- атрибуция – Вы должны указать авторство, предоставить ссылку на лицензию и указать, внёс ли автор какие-либо изменения. Это можно сделать любым разумным способом, но не создавая впечатление, что лицензиат поддерживает вас или использование вами данного произведения.
- распространение на тех же условиях – Если вы изменяете, преобразуете или создаёте иное произведение на основе данного, то обязаны использовать лицензию исходного произведения или лицензию, совместимую с исходной.
История файла
Нажмите на дату/время, чтобы посмотреть файл, который был загружен в тот момент.
| Дата/время | Миниатюра | Размеры | Участник | Примечание | |
|---|---|---|---|---|---|
| текущий | 14:41, 17 июля 2020 | | 1344 × 576 (13 Кб) | SemperVinco | Optimized svg code |
| 06:08, 28 июня 2017 |  | 1260 × 540 (8,06 Мб) | Shiyu Ji | Reverted to version as of 05:28, 28 June 2017 (UTC) | |
| 06:05, 28 июня 2017 |  | 540 × 1260 (7,33 Мб) | Shiyu Ji | vertical for better display | |
| 05:28, 28 июня 2017 |  | 1260 × 540 (8,06 Мб) | Shiyu Ji | User created page with UploadWizard |
Использование файла
Следующая страница использует этот файл:
Глобальное использование файла
Данный файл используется в следующих вики:
- Использование в ca.wikipedia.org
- Использование в de.wikipedia.org
- Использование в en.wikipedia.org
- Использование в es.wikipedia.org
- Использование в fa.wikipedia.org
- Использование в fr.wikipedia.org
- Использование в it.wikipedia.org
- Использование в ja.wikipedia.org
- Использование в sr.wikipedia.org
- Использование в uk.wikipedia.org
- Использование в zh.wikipedia.org