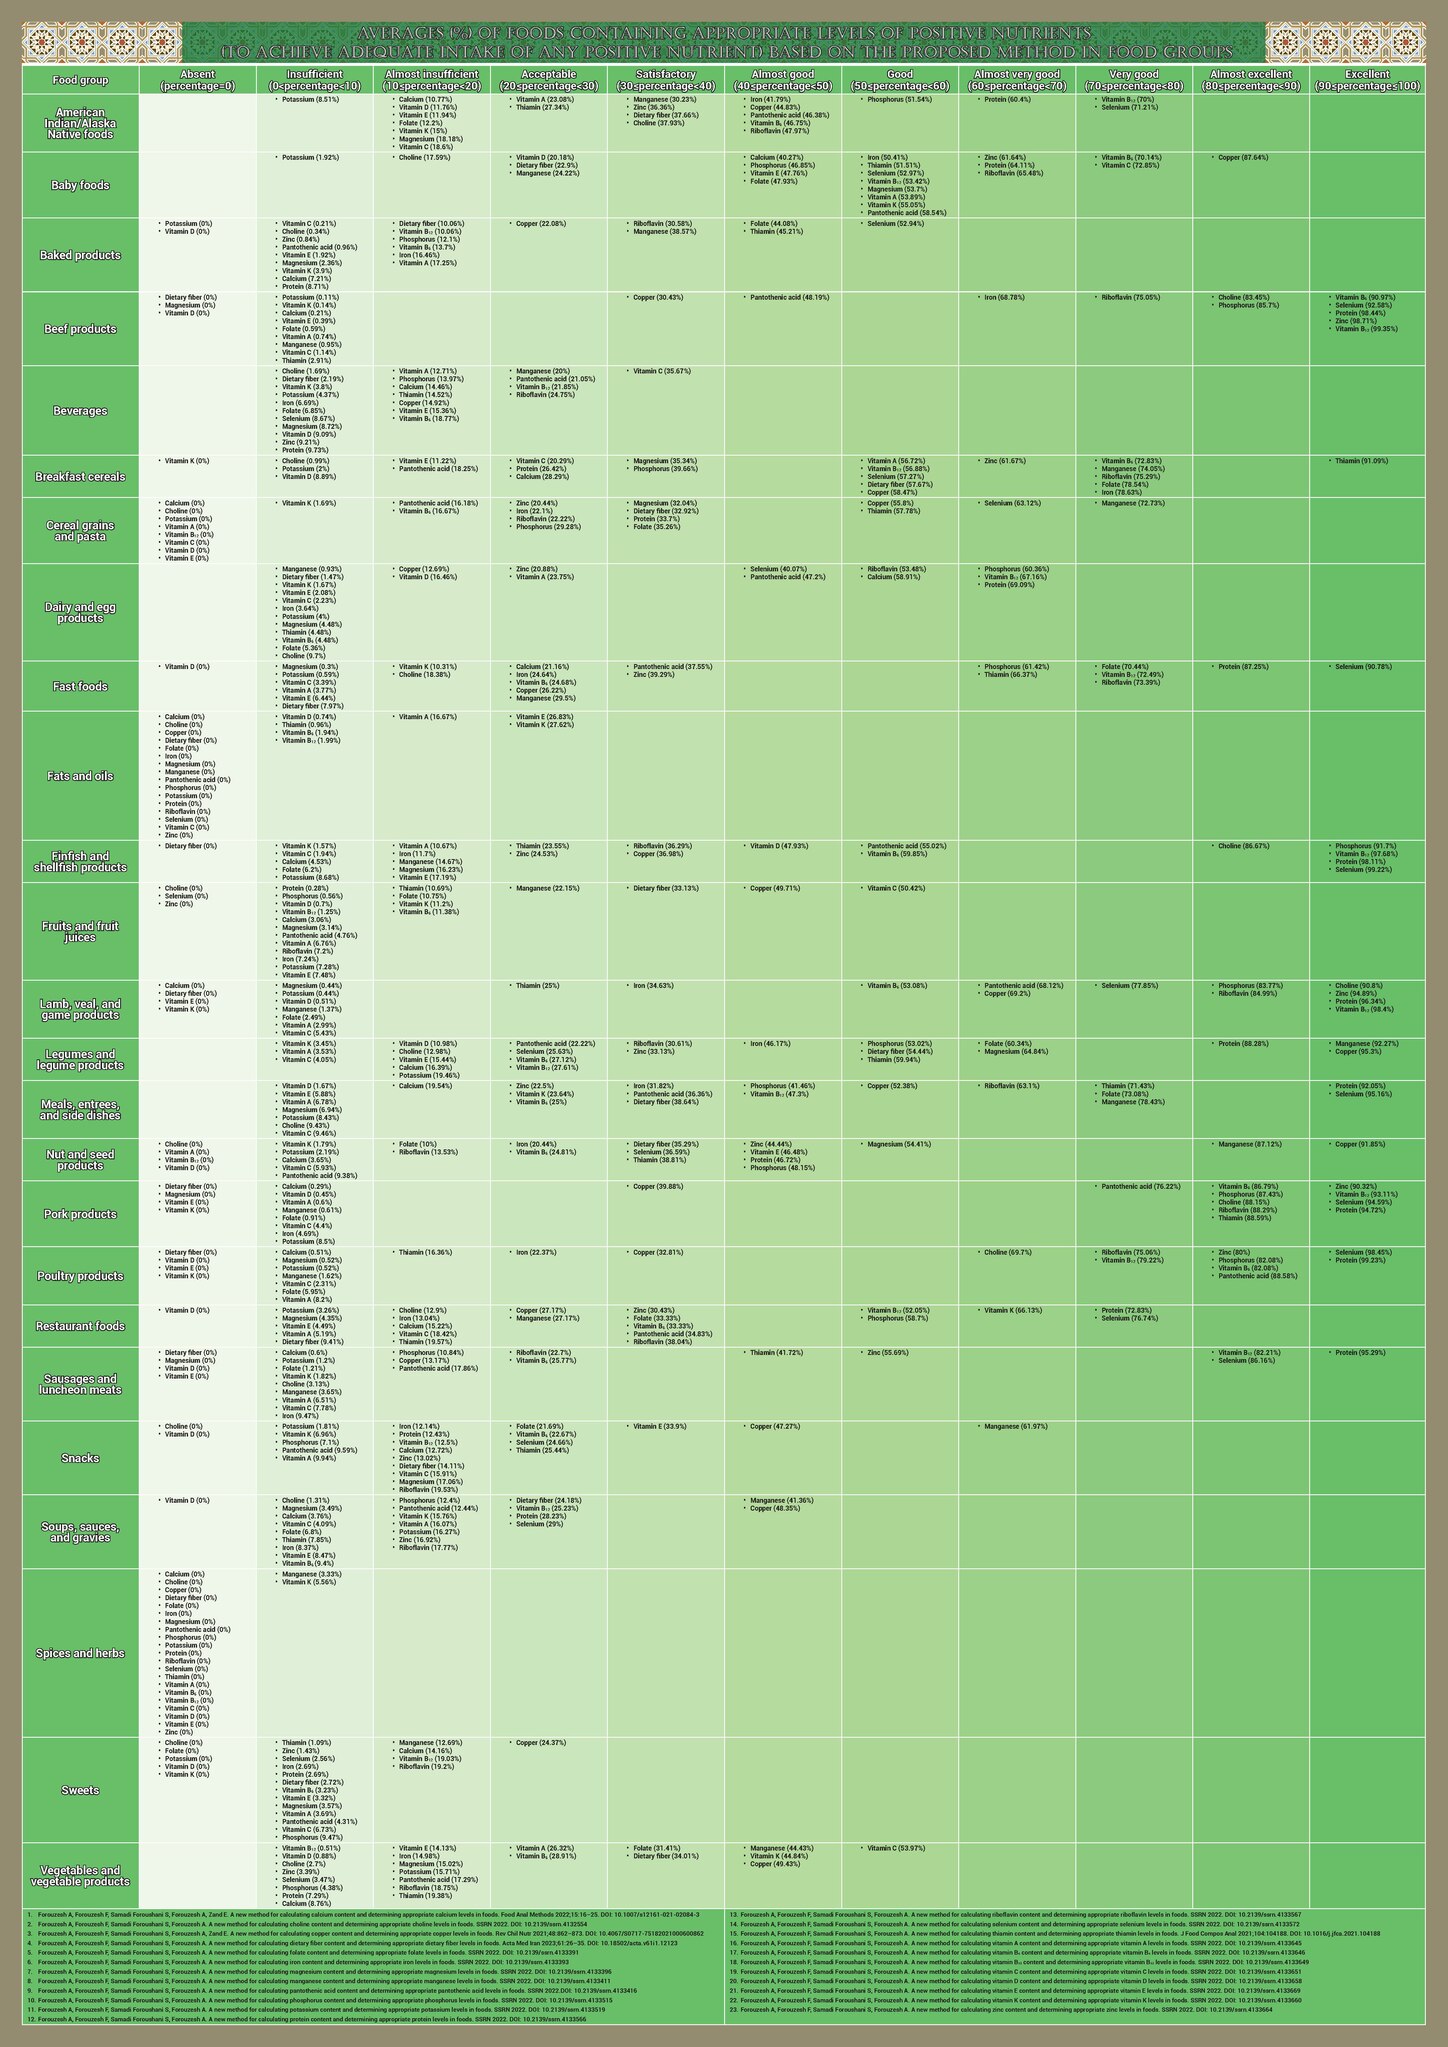
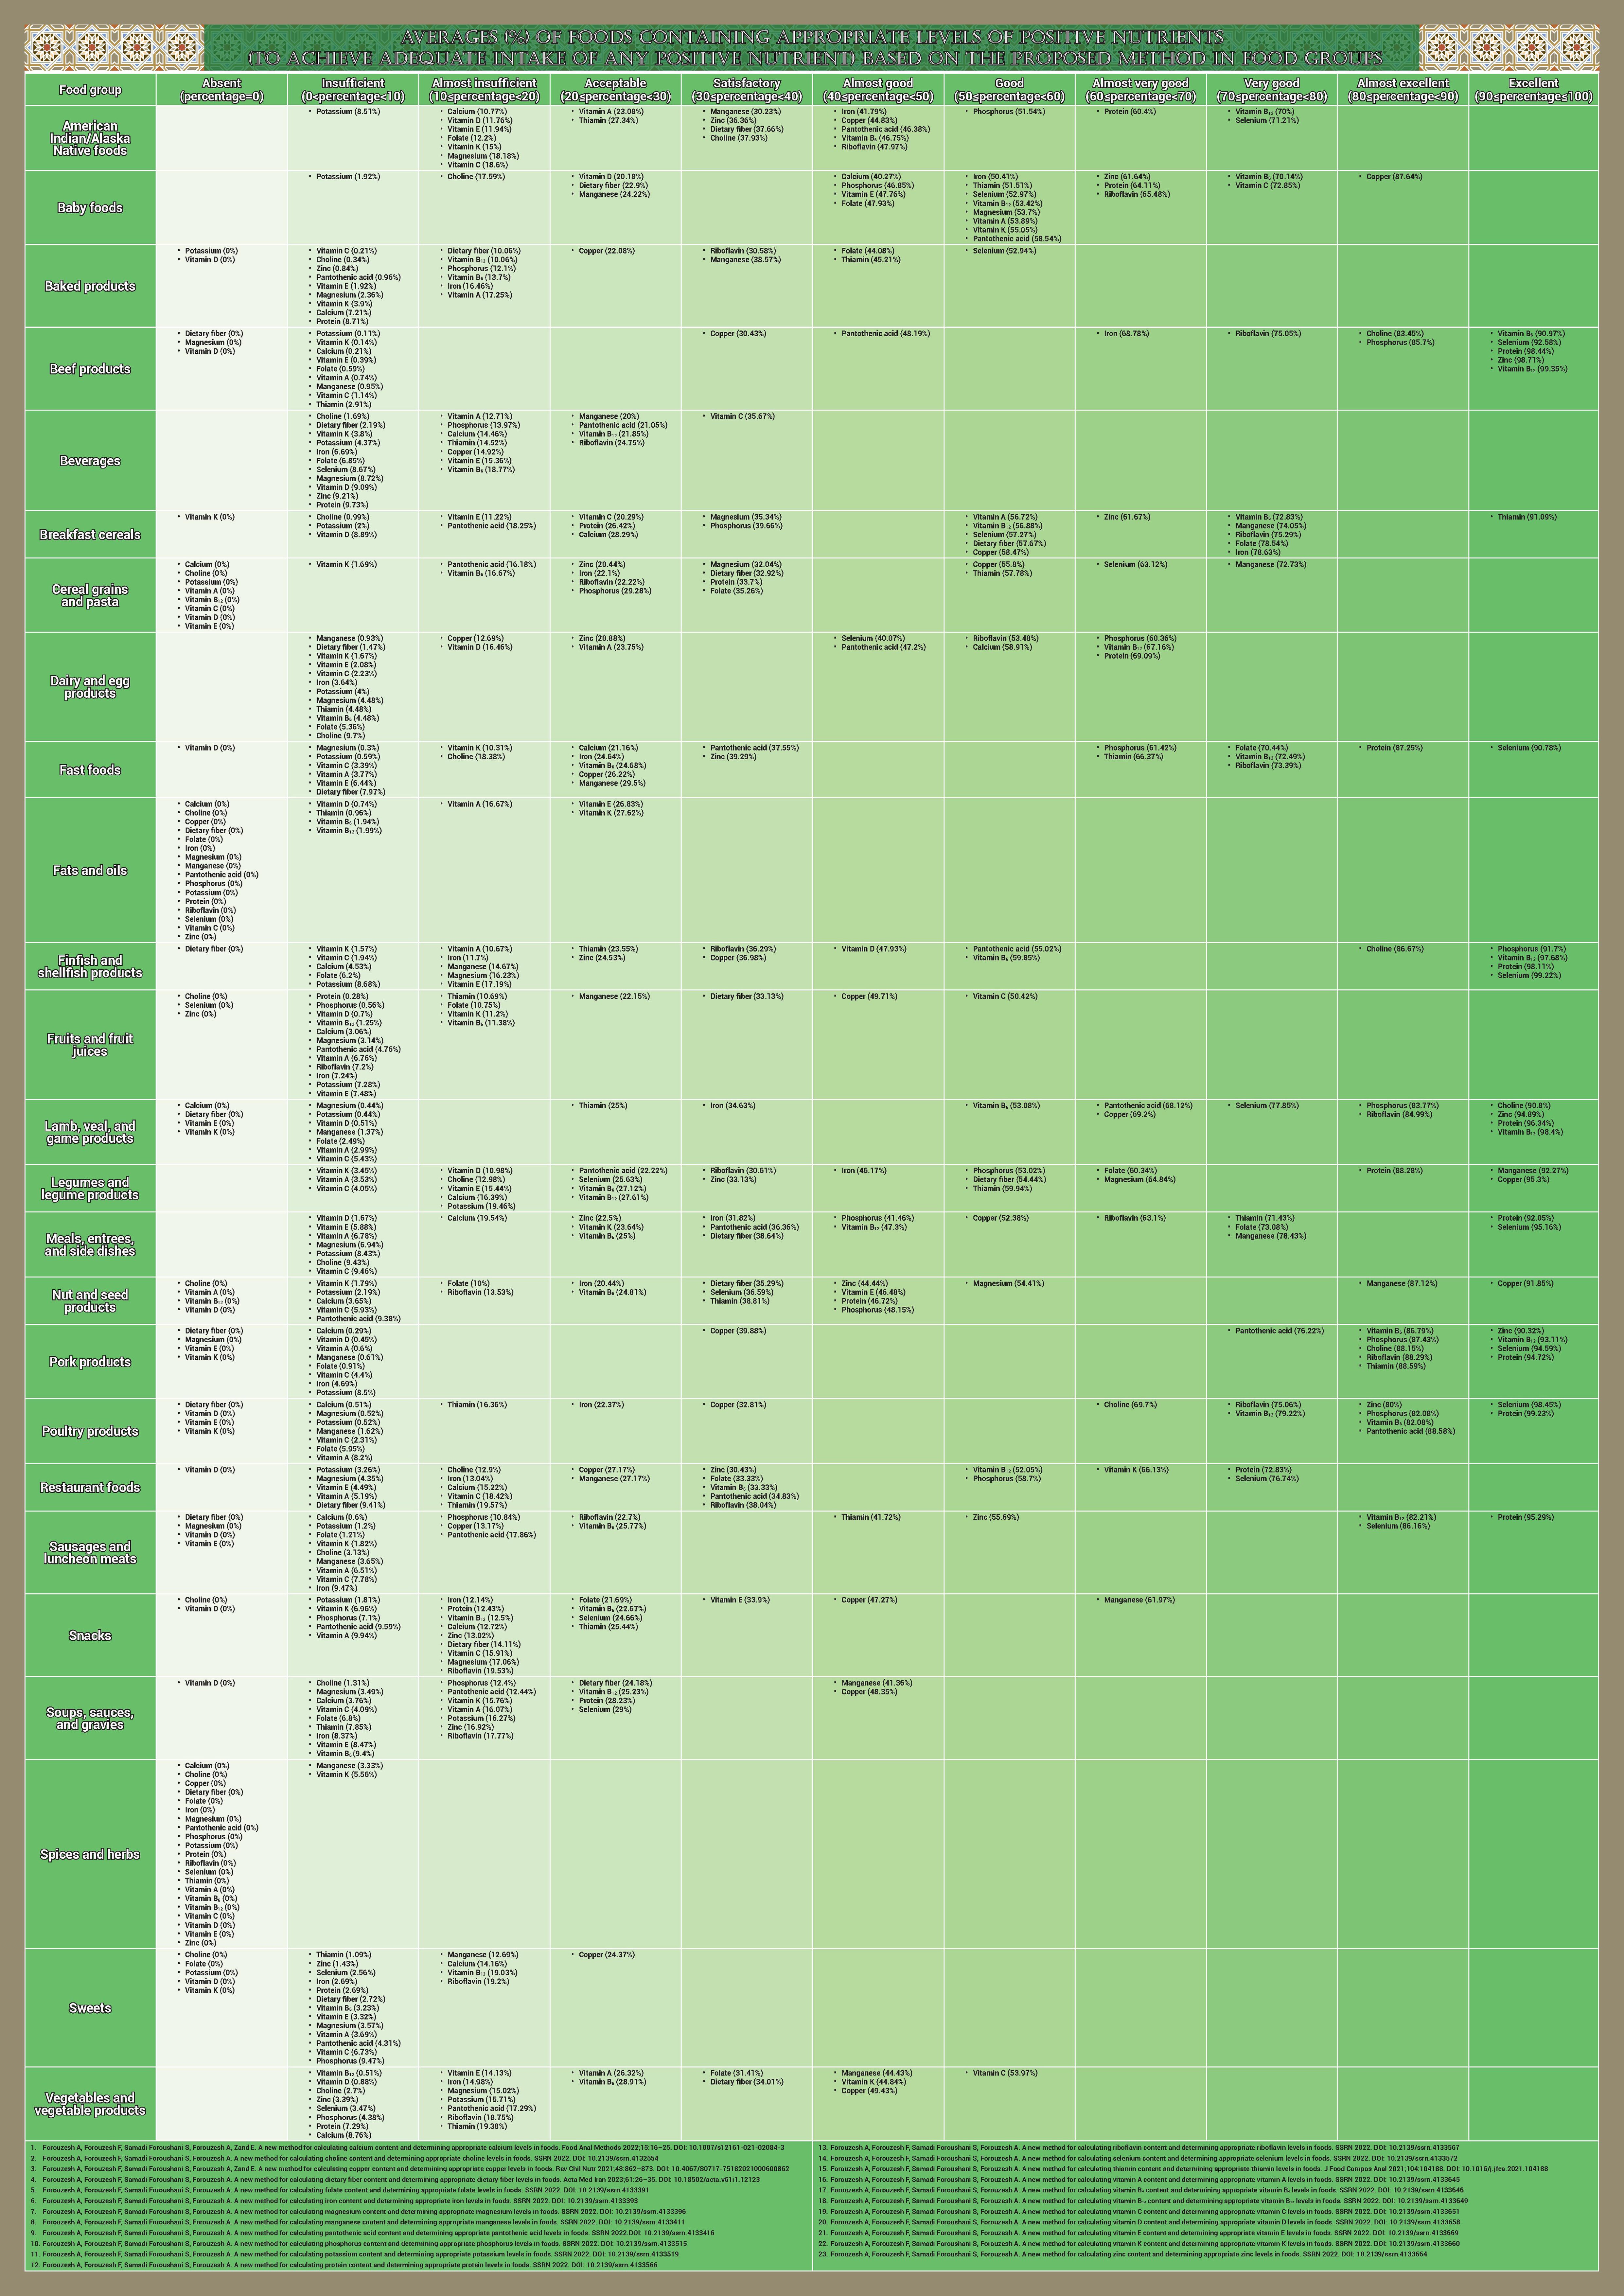
English: About 96.5% of foods contained calcium. On the basis of the proposed method, the average (%) of foods containing appropriate calcium levels in food groups was 11.38%, of which 8.39% was the average of calcium source (good source of calcium) foods, and 2.99% was the average of high-calcium (excellent source of calcium) foods.
About 96.5% of foods contained choline. On the basis of the proposed method, the average (%) of foods containing appropriate choline levels in food groups was 21.91%, of which 19.35% was the average of choline source (good source of choline) foods, and 2.56% was the average of high choline (excellent source of choline) foods.
About 97% of foods contained copper. On the basis of the proposed method, the average (%) of foods containing appropriate copper levels in food groups was 41.24%, of which 23.92% was the average of copper source (good source of copper) foods, and 17.32% was the average of high copper (excellent source of copper) foods.
About 58% of foods contained dietary fiber. On the basis of the proposed method, the average (%) of foods containing appropriate dietary fiber levels in food groups was 16.75%, of which 11.85% was the average of dietary fiber source (good source of dietary fiber) foods, and 4.9% was the average of high dietary fiber (excellent source of dietary fiber) foods.
About 91% of foods contained folate (also known as folacin, folic acid, and vitamin B9). On the basis of the proposed method, the average (%) of foods containing appropriate folate levels in food groups was 22.62%, of which 11.23% was the average of folate source (good source of folate) foods, and 11.39% was the average of high folate (excellent source of folate) foods.
About 96.8% of foods contained iron. On the basis of the proposed method, the average (%) of foods containing appropriate iron levels in food groups was 22.12%, of which 13.69% was the average of iron source (good source of iron) foods, and 8.43% was the average of high iron (excellent source of iron) foods.
About 97.2% of foods contained magnesium. On the basis of the proposed method, the average (%) of foods containing appropriate magnesium levels in food groups was 13.81%, of which 10.7% was the average of magnesium source (good source of magnesium) foods, and 3.11% was the average of high magnesium (excellent source of magnesium) foods.
About 97.8% of foods contained manganese. On the basis of the proposed method, the average (%) of foods containing appropriate manganese levels in food groups was 31.37%, of which 15.08% was the average of manganese source (good source of manganese) foods, and 16.29% was the average of high manganese (excellent source of manganese) foods.
About 96.2% of foods contained pantothenic acid (also known as pantothenate and vitamin B5). On the basis of the proposed method, the average (%) of foods containing appropriate pantothenic acid levels in food groups was 30.05%, of which 21.85% was the average of pantothenic acid source (good source of pantothenic acid) foods, and 8.2% was the average of high pantothenic acid (excellent source of pantothenic acid) foods.
About 97.2% of foods contained phosphorus. On the basis of the proposed method, the average (%) of foods containing appropriate phosphorus levels in food groups was 39.68%, of which 33.53% was the average of phosphorus source (good source of phosphorus) foods, and 6.15% was the average of high phosphorus (excellent source of phosphorus) foods.
About 98.2% of foods contained potassium. On the basis of the proposed method, the average (%) of foods containing appropriate potassium levels in food groups was 4.61%, of which 4.43% was the average of potassium source (good source of potassium) foods, and 0.18% was the average of high potassium (excellent source of potassium) foods.
About 95.9% of foods contained protein. On the basis of the proposed method, the average (%) of foods containing appropriate protein levels in food groups was 51.69%, of which 22.68% was the average of protein source (good source of protein) foods, and 29.01% was the average of high protein (excellent source of protein) foods.
About 95.9% of foods contained riboflavin (also known as vitamin B2). On the basis of the proposed method, the average (%) of foods containing appropriate riboflavin levels in food groups was 40.13%, of which 23.58% was the average of riboflavin source (good source of riboflavin) foods, and 16.55% was the average of high riboflavin (excellent source of riboflavin) foods.
About 94.5% of foods contained selenium. On the basis of the proposed method, the average (%) of foods containing appropriate selenium levels in food groups was 51.19%, of which 16.87% was the average of selenium source (good source of selenium) foods, and 34.32% was the average of high selenium (excellent source of selenium) foods.
About 95.6 % of foods contained thiamin (also known as vitamin B1 and aneurin)). On the basis of the proposed method, the average (%) of foods containing appropriate thiamin levels in food groups was 32.46 %, of which 17.54 % was the average of thiamin source (good source of thiamin) foods, and 14.92 % was the average of high thiamin (excellent source of thiamin) foods.
About 65.6% of foods contained vitamin A. On the basis of the proposed method, the average (%) of foods containing appropriate vitamin A levels in food groups was 12.63%, of which 5.05% was the average of vitamin A source (good source of vitamin A) foods, and 7.58% was the average of high vitamin A (excellent source of vitamin A) foods.
About 95.2% of foods contained vitamin B6 (pyridoxine and related compounds). On the basis of the proposed method, the average (%) of foods containing appropriate vitamin B6 levels in food groups was 34.17%, of which 17.85% was the average of vitamin B6 source (good source of vitamin B6) foods, and 16.32% was the average of high vitamin B6 (excellent source of vitamin B6) foods.
About 61.3% of foods contained vitamin B12 (also known as cobalamin). On the basis of the proposed method, the average (%) of foods containing appropriate vitamin B12 levels in food groups was 43.57%, of which 9.05% was the average of vitamin B12 source (good source of vitamin B12) foods, and 34.52% was the average of high vitamin B12 (excellent source of vitamin B12) foods.
About 48.7% of foods contained vitamin C (also known as L-ascorbic acid). On the basis of the proposed method, the average (%) of foods containing appropriate vitamin C levels in food groups was 13.81%, of which 4.53% was the average of vitamin C source (good source of vitamin C) foods, and 9.28% was the average of high vitamin C (excellent source of vitamin C) foods.
About 37.1% of foods contained vitamin D (also known as calciferol). On the basis of the proposed method, the average (%) of foods containing appropriate vitamin D levels in food groups was 5.21%, of which 2.86% was the average of vitamin D source (good source of vitamin D) foods, and 2.35% was the average of high vitamin D (excellent source of vitamin D) foods.
About 92% of foods contained vitamin E. On the basis of the proposed method, the average (%) of foods containing appropriate vitamin E levels in food groups was 11.23%, of which 6.46% was the average of vitamin E source (good source of vitamin E) foods, and 4.77% was the average of high vitamin E (excellent source of vitamin E) foods.
About 79.2% of foods contained vitamin K. On the basis of the proposed method, the average (%) of foods containing appropriate vitamin K levels in food groups was 12.08%, of which 5.98% was the average of vitamin K source (good source of vitamin K) foods, and 6.1% was the average of high vitamin K (excellent source of vitamin K) foods.
About 97.5% of foods contained zinc. On the basis of the proposed method, the average (%) of foods containing appropriate zinc levels in food groups was 34.39%, of which 17.63% was the average of zinc source (good source of zinc) foods, and 16.76% was the average of high zinc (excellent source of zinc) foods.
